03 - Debugging
The Console - Your best friend
This chapter is a short but important intermezzo.
Maybe you have already encountered the console. Whenever you write code, your computer does not understand it will tell you in the console. And worse, it will also block you from running your scene! C# as a programming language is very, very picky about its syntax and what works and what not. “Strongly typed” is the fancy computer science term for that. C# even expects you to care about capitalization. We as humans are prone to making mistakes and thus eventually you will produce an error. If you haven’t, do so now. Any typo is good enough:
transform.positio = transform.position + new Vector3(1, 0, 0)* Time.deltaTime;
Error in the Console
As soon as you do this, your computer will complain. But not only will he complain, he will also try to tell you what it is, he does not understand:
Assets Scripts MyScript.cs(19,19): error CS1061: 'Transform' does not contain a definition for 'positio' and no accessible extension method 'positio' accepting a first argument of type 'Transform' could be found (are you missing a using directive or an assembly reference?)
Here, he tells us he knows about Transform but does not understand “positio”. Of course he does not.
He is also kind enough to print out the line in which he has problems understanding you. So this is the place where you should start your process of debugging. You can even just double-click on the error message and Unity will take you to the line that is causing the error.
Dealing with errors can be very disheartening. But!… what you always have to keep in mind is, that this never means that you are a bad programmer. Mistakes happen! Especially in the beginning. They will stay, and that’s fine. Everyone knows this happens, and that’s why every code editor will try to do it’s best to prevent you from making errors. Auto-completion for example can help to avoid errors. Any red squiggly line in the code editor is an attempt to notify you, that Unity will produce an Error in the code.
Apart from errors, Unity also displays “Warnings” in the console. Warnings will not break your code. This could for example happen if you use methods that are “Obsolete”. Meaning they are still here for legacy reasons, but will in later versions of Unity be removed. If you are just playing around, ignore stuff like this, but at least consider what the alternative is.
Warnings can be manifold, so if you run into one and the displayed message isn’t helpful try looking it up in your favorite search engine.
The power of “Debug.Log”
Often in programming we think about what we want to achieve and yet the computer does not do what we want him to. “Computer says no.” As a beginner, we often assume the computer knows something it doesn’t. So we can ask the computer to explicitly tell us what he understands is going on.
You could for example print out the value for our sinus Variable at each frame to check if it is staying between -1 and 1.
float sinus = Mathf.sin(Time.time);
Debug.Log(sinus);
If you now run your code and check the Console, you will see the value printed out each Frame.
You can have as many Debug.Log Statements in your code as you want, but they will slow down the execution of your code, so once you don’t need one anymore, get rid of it. They also should not be in your code anymore once you “ship” it.
If you have a Debug.Log statement in your code, which you don’t need but think it could be useful down the line, you can also just comment it out for the moment being.
float sinus = Mathf.sin(Time.time);
//Debug.Log(sinus);
And while this is a helpful way to get a better grasp of your code, you shouldn’t get in the habit of cluttering them all over the place in your code.
Debug Inspector
Now it would be tedious to expose every private variable you want to see on a script via Debug.Log(). Unity also provides us with the “Debug mode” in the Inspector. To enable it, all you have to do is, click on the tiny “burger-menu” in the upper right corner of the Inspector and select “Debug”. Here you can also switch back to the “normal” mode.
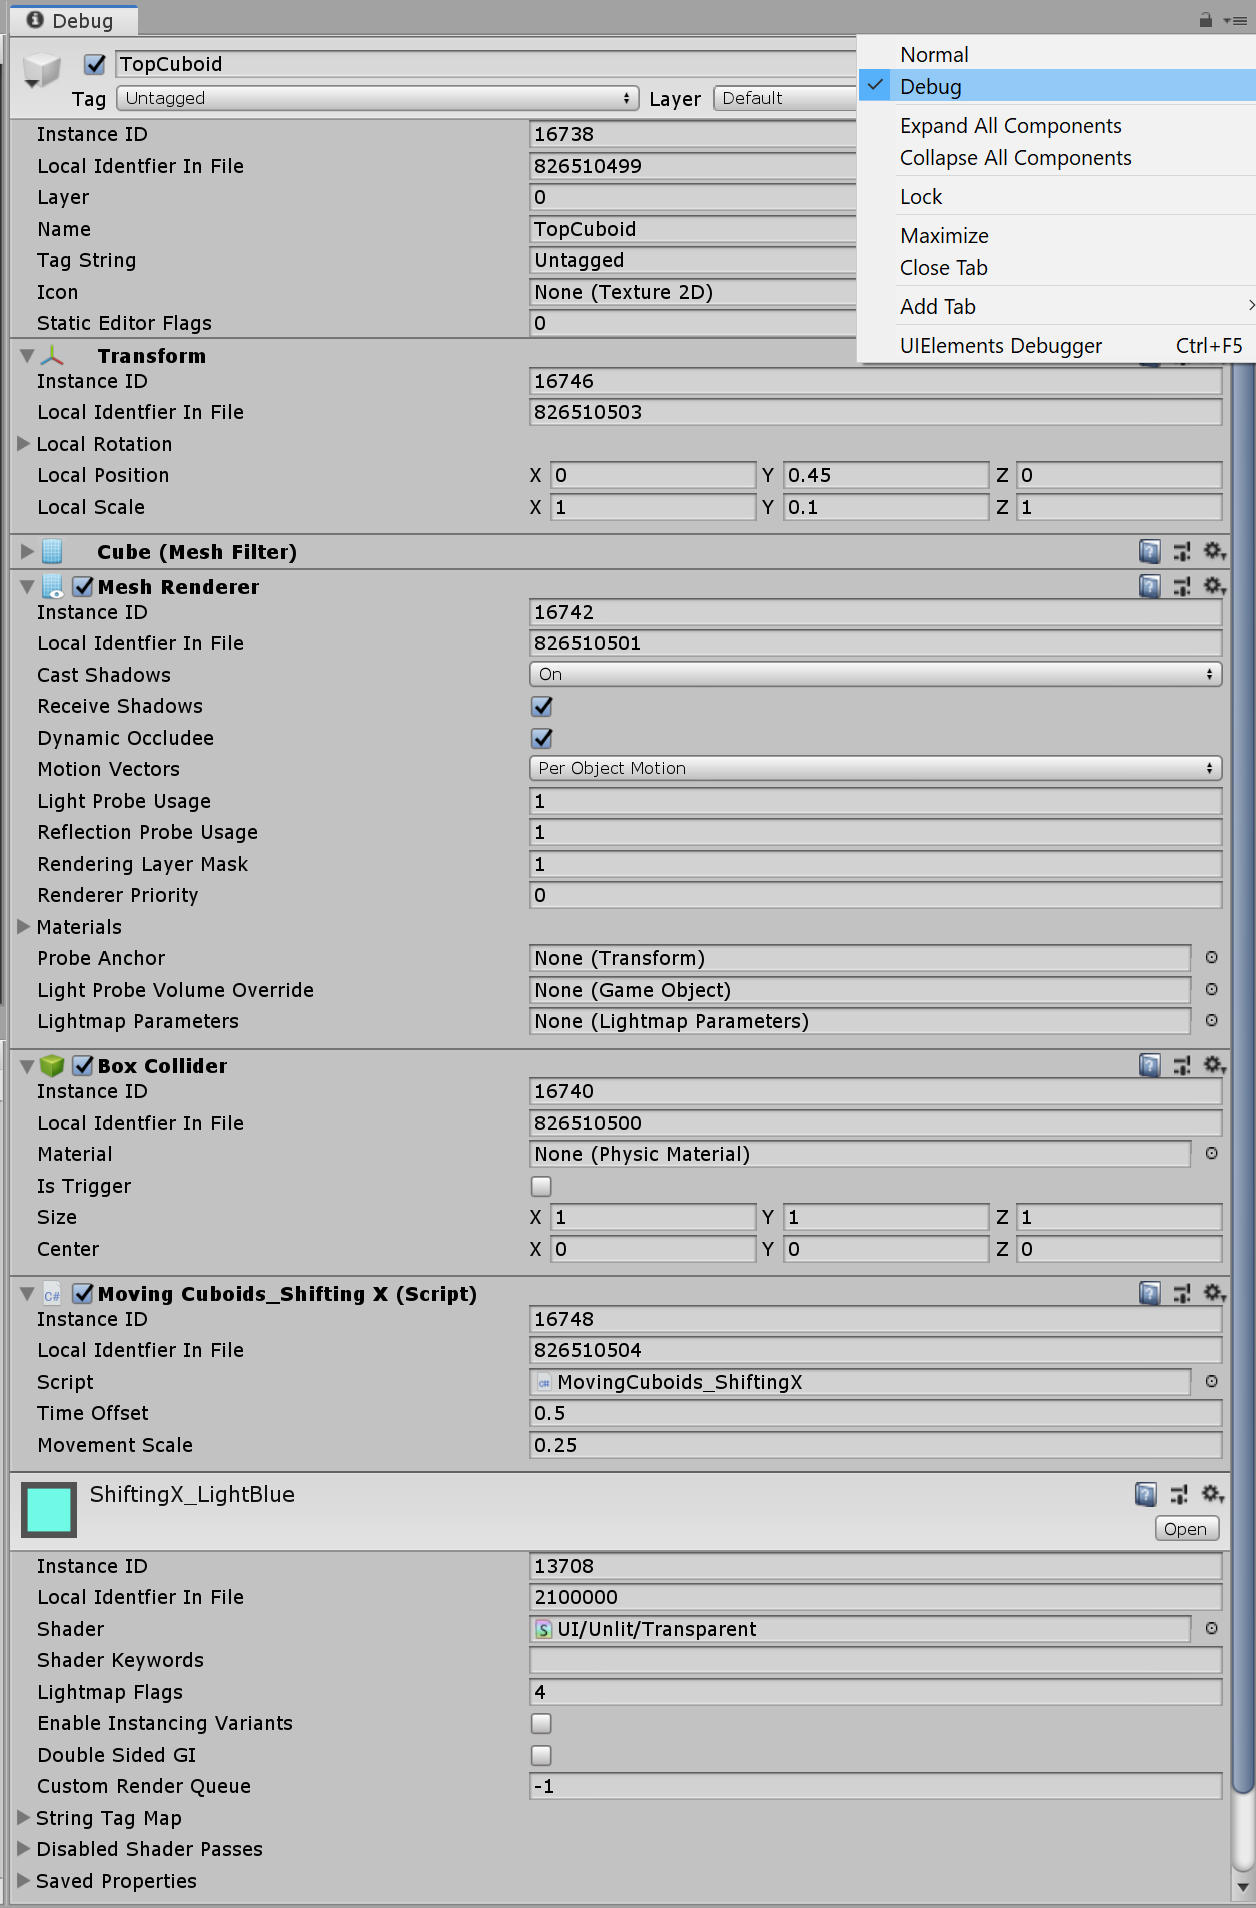
Inspector in Debug Mode
As soon as you enable “Debug mode”, you see private variables from your script show up next to the public ones. Unity will then also expose a lot of under the hood options and variables and with these create a lot of clutter inside your inspector. Thus you don’t want this to be the default.
Breakpoints
Besides Debug.Log you can also use “breakpoints”. Breakpoints allow you to specify a line of code inside your IDE and once your program reaches that line, Unity will switch back to the IDE and you can click on all the variables and check their current values. This is a fantastic tool for debugging your code. You can even go into playmode from the IDE. But it is restricted to IDEs, so you will need to use Visual Studio Community or Jetbrains Rider, while Code Editors like Visual Studio Code will not suffice.
Here is how to use them in Visual Studio Community, which ships with Unity:
Inside the Code Editor on the far left of the document window you will see grey bar. You can click on that bar in front of the line you want to pause on. At this line a red dot will appear and it will color the line red, meaning it set your breakpoint up.
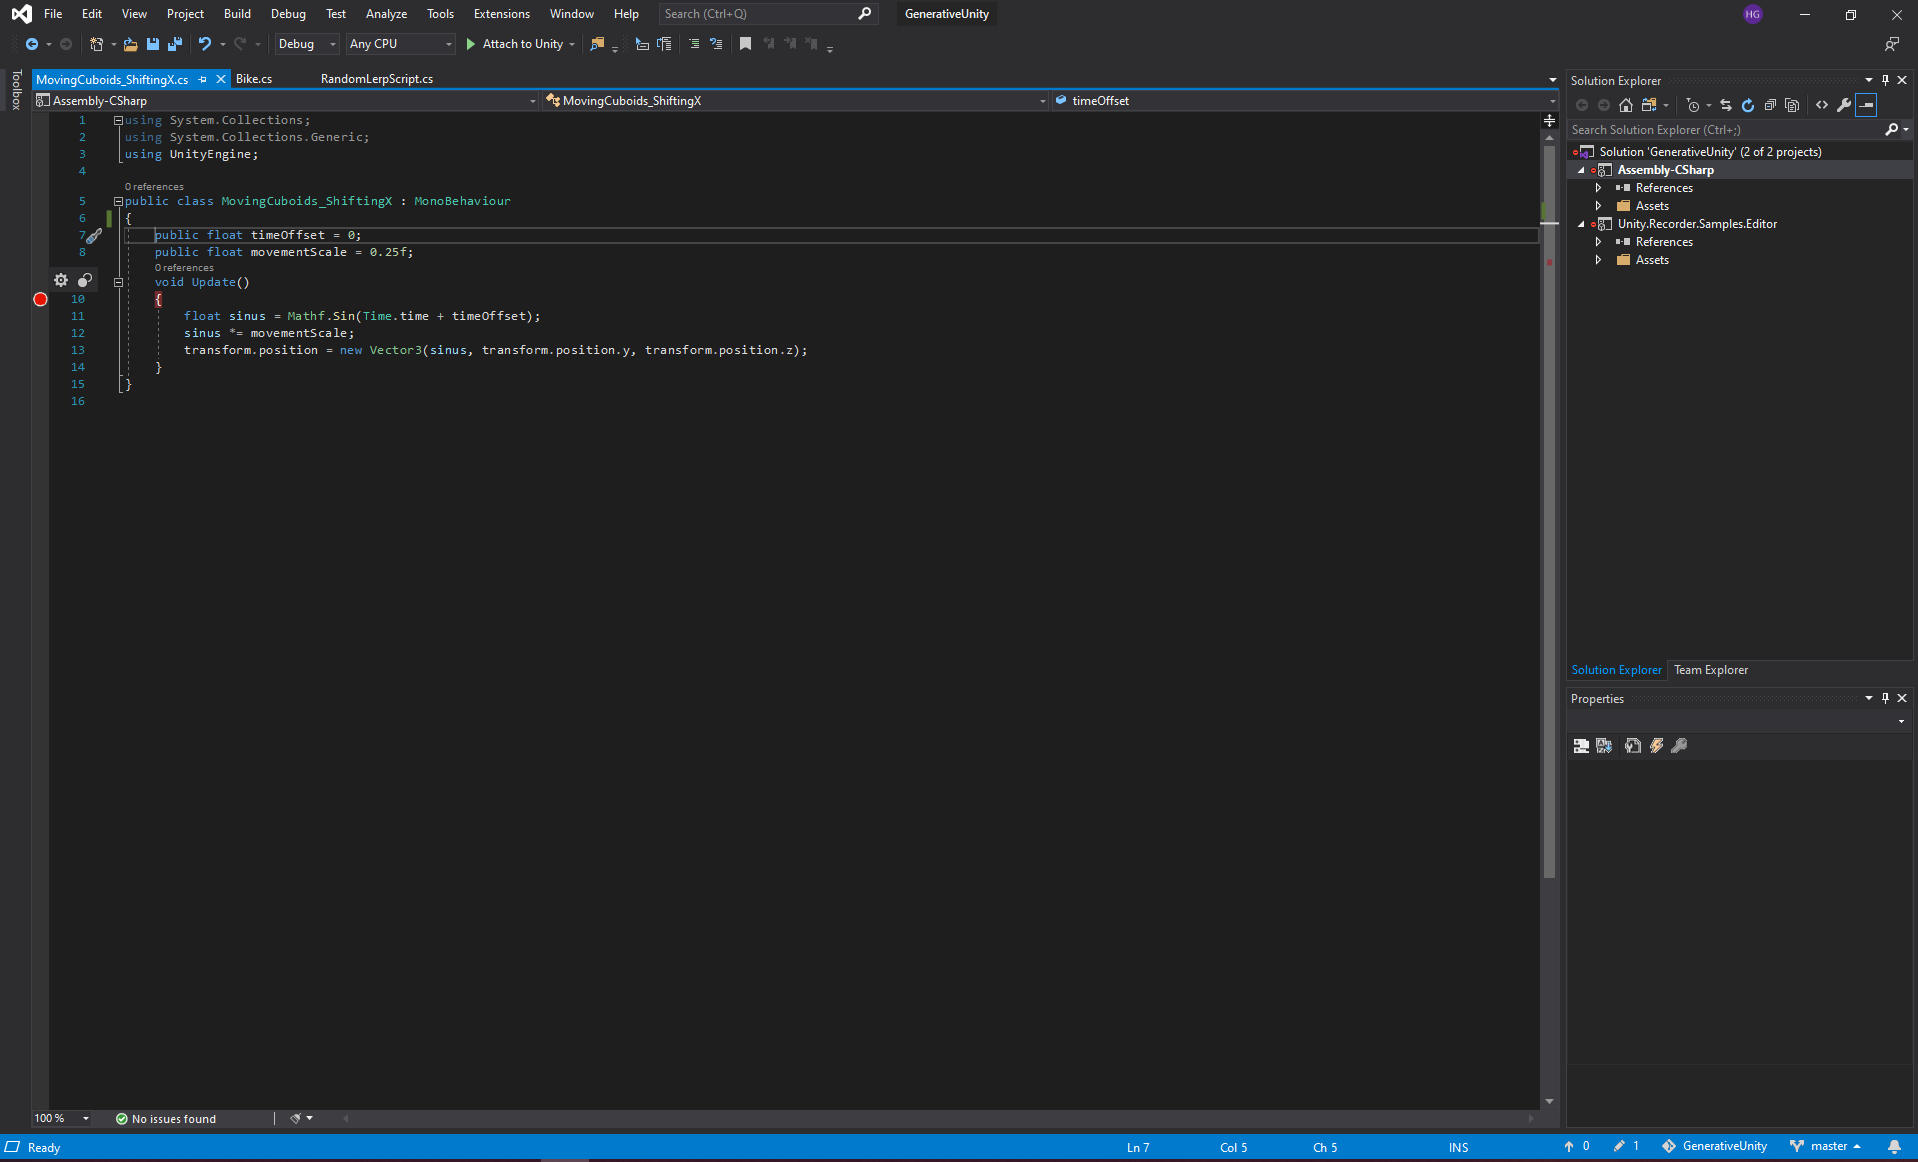
Added BreakPoint in Visual Studio
In the top bar of your IDE you will find a button called “Attach to Unity” and a drop down arrow right beneath it which will allow you to choose “Attach to Unity and Play”. Select either. If you opt for the first one you have to switch to Unity and manually enter play mode.
The code then runs and will stop the moment it encounters the line you specified. Unity will then switch back to your IDE and mark the line yellow. It will also pop up a few windows on the bottom, e.g. a list of all the variables active and which values are assigned to them. You can explore the object.
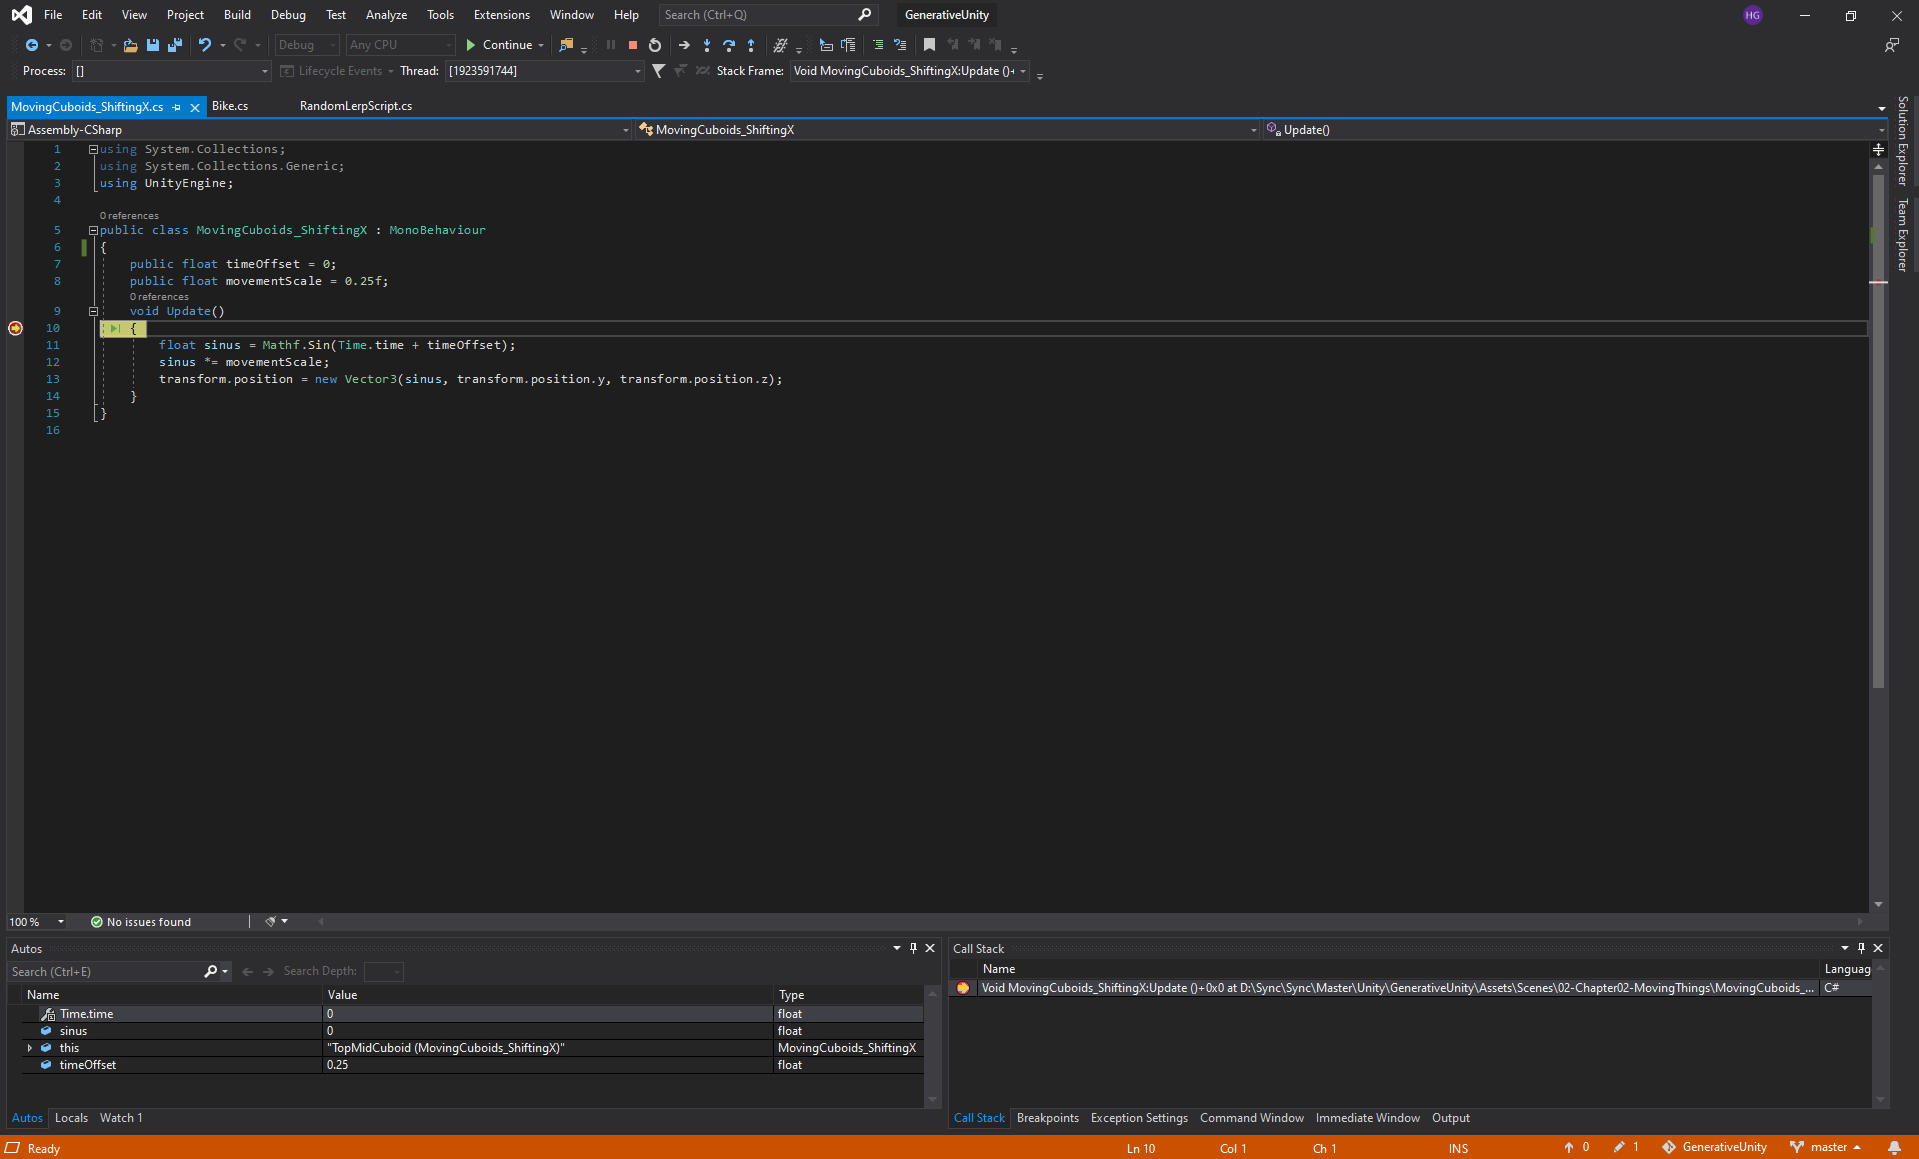
Hold on Breakpoint
Using the F10 and F11 Keys you can step through the code. Step In will become interesting once we have looked at Methods in chapter five. For now, F10 will allow you to go through the code line by line. This allows you to see what is going on inside your script.
To stop debugging you can press the red “Stop Button” that appeared the moment you pressed start, or stop the scene inside Unity. I should note that by default you cannot edit code while debugging is running. And for now, keep it that way.
Once you have found your problem you can press the red dot again and it will vanish, bringing everything back to normal.
Still stuck?
If you are stuck, there are several places to look for help.
The first place you should always check out are the Unity Documentation.
The Unity Documentation is helpful and comprises two different parts. The first part is the manual. It comprises descriptions of all components and workflows in Unity as well as tutorials and guides on some topics. It also has some great insight about optimizations for your scenes and so on. Be sure to check it out.
The other part is the Unity Scripting API. (You can switch between both in the upper right corner.)
API is short for Application programming interface and it’s the things Unity lays open for you to access through code. Like the transform.position. So you could search for transform. The first entry will show you a list of all the things you can access on that component. That is a lot of stuff and you will never need everything.
Now imagine all other components and think about everything they might lay open for access. Nobody can remember everything, so it’s great that we can read up on these things.
If you choose one of its properties or functions, you can get even more details and in most cases even see example code, which is helpful!
You will always find the most recent version of the docs online, but if you have a slow internet connection, you could try Zeal as an offline documentation browser. I have it installed on my Laptop as a great way to search the docs when I’m on the train.